


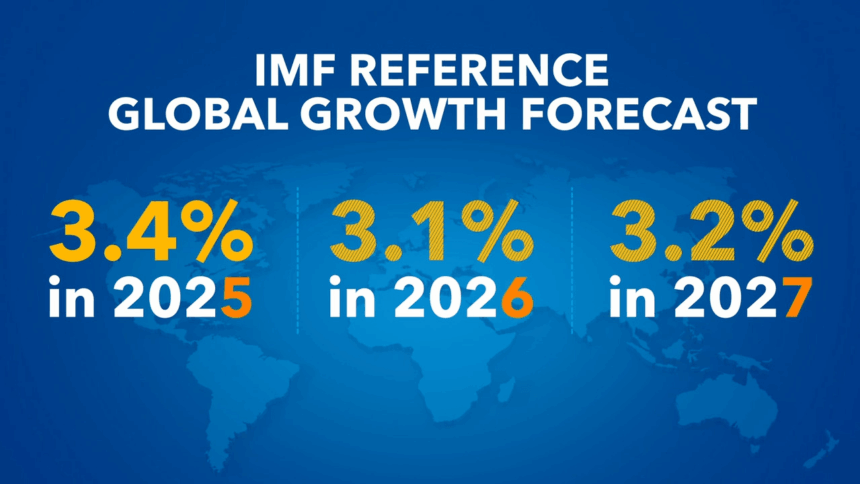
When examining the International Monetary Fund’s (IMF) “World Economic Outlook” report, it becomes clearly evident that the US is becoming a global political and economic powerhouse. Forecasts suggest that by 2026, the European Union (EU) economy will have a volume of $23 trillion, while the US economy is projected to reach $32.4 trillion.
Thus, the EU economy will be equivalent to approximately 71% of the US economy. In contrast, in 2008, the EU’s gross domestic product stood at $19.3 trillion, surpassing the US economy’s $14.8 trillion volume by 31%.
What Has Changed in the Last 20 Years?
The global financial crisis that began in 2008 played a critical role in the decline of the European economy. A number of Eurozone countries, including Greece, Italy, Spain, Portugal, Ireland, and Cyprus, faced debt problems. Although financial aid and strict austerity measures were implemented during the crisis, the overall volume of the EU economy weakened in subsequent years.
Against the backdrop of these processes, the US economy surpassed the EU in dollar terms for the first time in 2015. This change was driven not only by economic growth but also by the weakening of the euro against the US dollar.
The Impact of Brexit and the Pandemic
Another significant event influencing this process was the United Kingdom’s departure from the union. The “Brexit” process, which began after the 2016 referendum, concluded with the UK’s official exit from the EU in January 2020.
As the UK was the EU’s second-largest economy, its departure significantly affected the EU’s overall economic indicators. During the same period, the economic crisis caused by the COVID-19 pandemic also had a negative impact on the EU’s GDP. Consequently, the volume of the EU economy receded to $15.5 trillion in 2020.
Since the pandemic began in 2020, the development trajectories of the US and EU economies have diverged further. Despite high inflation and interest rates, the US economy recovered more rapidly following the pandemic. The country’s GDP is expected to reach $32.4 trillion in 2026.
Productivity and Income Gaps
According to IMF data, total factor productivity in the EU is approximately 20% lower than in the US. Per capita income in the EU’s major developed economies is also about 30% lower than the US average.
The IMF has reported that by 2026, per capita income in Europe is projected to fall to roughly 70% of US levels, and this gap continues to widen.
The gap in labor productivity between the Eurozone and the US is also notable. While the difference in hourly productivity was approximately $9 in 2018, it rose to $21 in 2025. In the US, real GDP per working hour in 2025 was slightly over $100.